What Does a Current Data Analytics Syllabus Actually Cover?
A modern Data Analytics syllabus should teach the complete process of turning raw information into useful business insights. Instead of focusing only on software tools, a job-oriented program should explain how data is collected, prepared, analyzed, interpreted, visualized, and used for decision-making. Here are the major modules a current curriculum should include.
1. Data Collection and Extraction
Definition: Data collection is the process of gathering information from databases, spreadsheets, APIs, websites, business systems, or other sources.
What you learn: Students understand where business data comes from, how to import datasets, and how to identify relevant information for analysis. This creates the starting point for the entire analytics workflow.
2. Data Cleaning and Transformation
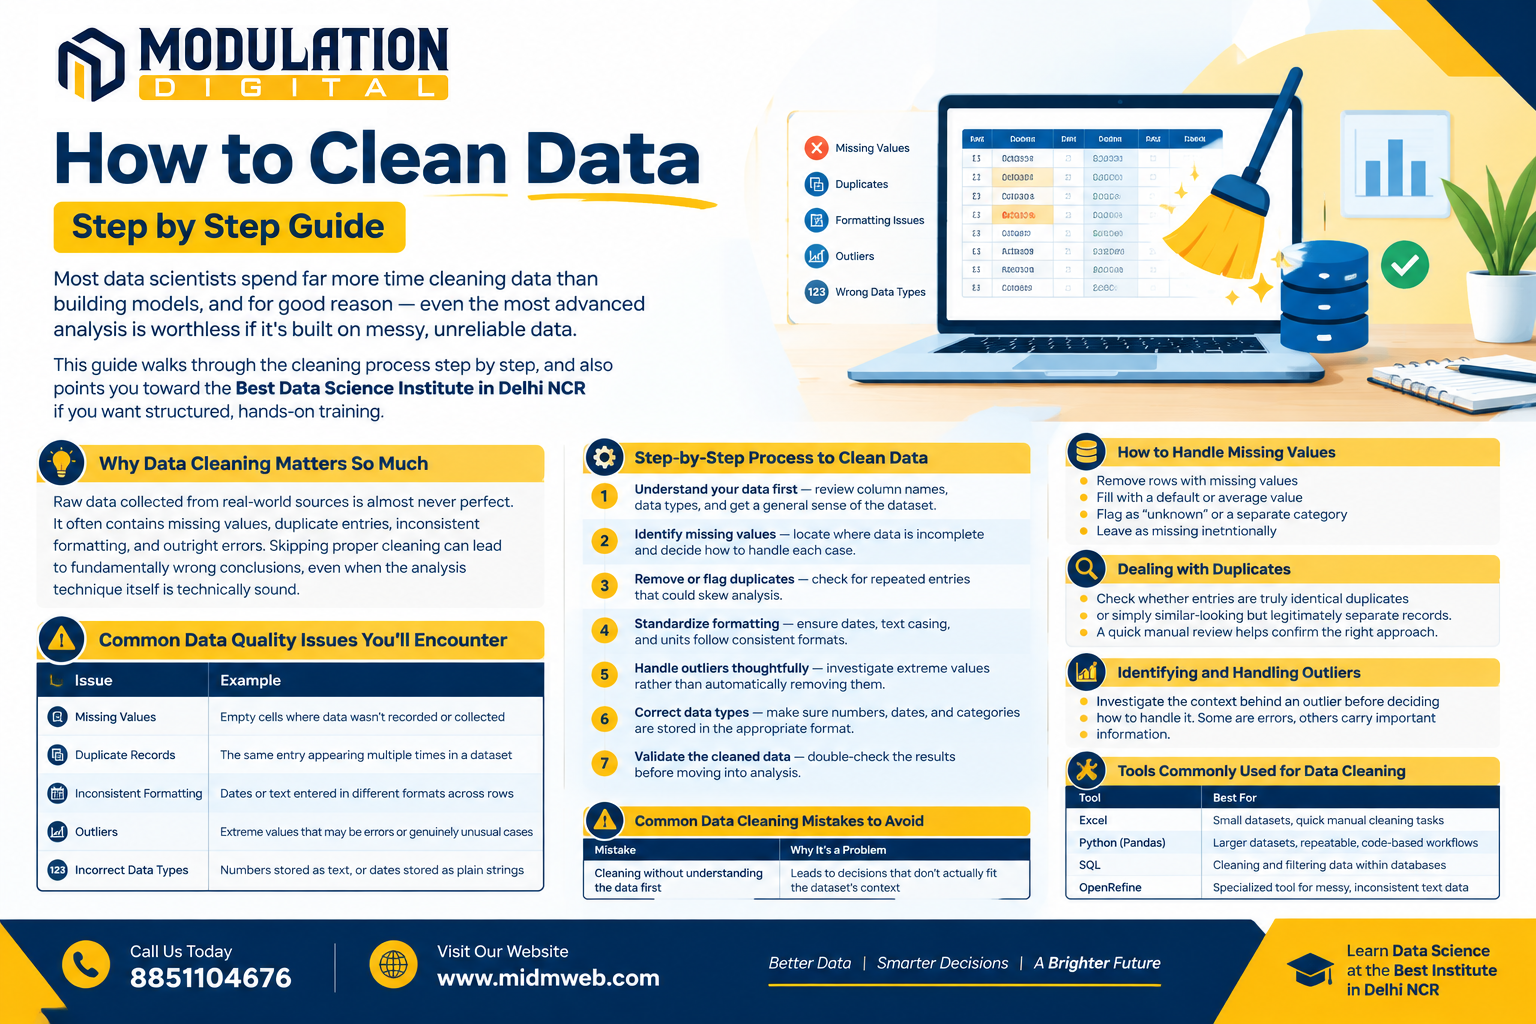
Definition: Data cleaning involves identifying and correcting inaccurate, incomplete, duplicated, or inconsistent data.
What you learn: Analysts learn techniques for handling missing values, removing duplicates, correcting formats, standardizing information, and transforming raw datasets into analysis-ready data using Excel, SQL, or Python.
3. Exploratory Data Analysis
Definition: Exploratory Data Analysis (EDA) is the process of investigating datasets to discover patterns, relationships, trends, and unusual values.
What you learn: Students use statistics, tables, charts, and Python libraries such as Pandas and NumPy to understand what the dataset is actually showing before drawing conclusions.
4. SQL and Database Analysis
Definition: SQL is a language used to retrieve, filter, combine, and analyze information stored in relational databases.
What you learn: A practical course should cover queries, joins, aggregations, subqueries, CTEs, and window functions. These skills allow analysts to work with business databases rather than depending entirely on spreadsheet exports.
5. Statistical Analysis
Definition: Statistical analysis uses mathematical techniques to identify relationships, distributions, trends, and meaningful differences within data.
What you learn: Students should understand concepts such as mean, median, standard deviation, correlation, probability, sampling, and hypothesis testing and learn when each technique is appropriate.
6. Python or R for Data Analytics
Definition: Python and R are programming languages commonly used for data manipulation, statistical analysis, automation, and advanced analytics.
What you learn: Python-based analytics can include Pandas, NumPy, Matplotlib, and Seaborn, while R can be used for statistical computing and visualization. Students should focus on solving analytical problems rather than simply memorizing programming syntax.
7. Predictive Analytics and Model Building
Definition: Predictive analytics uses historical data and statistical or machine-learning techniques to estimate potential future outcomes.
What you learn: Students can be introduced to regression, classification, feature preparation, model evaluation, and basic machine learning concepts. This module provides a foundation for progressing toward more advanced data science roles.
8. Data Visualization and Dashboard Development
Definition: Data visualization converts analytical results into charts, reports, and dashboards that people can understand quickly.
What you learn: Tools such as Power BI and Tableau can be used to create interactive dashboards, KPIs, filters, and business reports. The emphasis should be on choosing the right visualization and communicating the insight behind the numbers.
9. AI-Assisted Data Analytics
Definition: AI-assisted analytics uses artificial intelligence tools to accelerate selected parts of the analytical workflow.
What you learn: Students can use tools such as ChatGPT and Copilot to assist with SQL queries, Python code, spreadsheet formulas, data exploration, documentation, and repetitive analytical tasks. The analyst still needs to validate outputs and make the final analytical judgment.
10. Business Insights and Data Storytelling
Definition: Data storytelling is the process of presenting analytical findings in a way that connects numbers with a business problem or decision.
What you learn: Students learn to move beyond “what happened?” and explain why it happened, what it means, and what action could be taken. This is what turns technical analysis into business value.
11. End-to-End Data Analytics Projects
Definition: An end-to-end analytics project applies multiple stages of the data lifecycle to a realistic business problem.
What you learn: Students should work through the complete process—from data extraction and cleaning to SQL analysis, Python-based exploration, dashboard creation, and final recommendations. These projects also provide portfolio material that can demonstrate practical analytics skills to potential employers.
What Tools and Modules Should You Look For?
| Module | Skills Covered | Why It Matters |
| Foundations & Statistics | Data types, EDA, statistical reasoning | Base logic every analysis relies on |
| SQL | Querying, joins, database fundamentals | Pulls data from real company systems |
| Python or R | Data manipulation, predictive modeling | Scales beyond what Excel can handle |
| Power BI / Tableau | Interactive dashboards, visualization | What stakeholders actually review |
| Data Cleaning & Wrangling | Preparing raw, messy data for analysis | Most real analyst time goes here |
| AI-assisted Analytics | Using AI tools for faster exploration | Reflects how analysts now work |
What Career Roles Can You Get After Completing the Course?
Graduates of a solid data analytics course in Ghaziabad typically qualify for several related roles, depending on where their strengths lie:
- Data Analyst — interprets datasets to support business decisions
- Business Analyst — translates business requirements into data-driven insights
- Data Scientist — applies machine learning for predictive insights
- Business Intelligence Analyst — builds reports tracking performance indicators
- Marketing Analyst — studies customer behavior and campaign performance
- Financial Analyst — examines financial data for investment and budgeting decisions
- Product Analyst — evaluates product performance and recommends improvements
The breadth here is part of why analytics skills are considered future-proof — the same core toolkit (SQL, Python, dashboards) opens doors across industries, not just one sector.
How Much Can You Expect to Earn After the Course?
Pay varies by experience, company, and city, but general benchmarks hold across most markets:
- Freshers: typically ₹3–6 LPA, higher in major tech hubs or with larger companies
- Mid-level (2–5 years): generally ₹6–12 LPA
- Senior level: 12+ LPA for strong technical and analytical expertise
Proficiency in SQL, Python, Power BI, and Tableau, combined with real project experience, tends to be the biggest factor separating higher offers from average ones — more than the certificate itself.
What Skills Should You Actually Walk Away With?
Beyond tool proficiency, a good program builds both technical and soft skills together:
Technical: SQL for data querying, Python or R for analysis and modeling, data cleaning and wrangling, dashboard building in Power BI/Tableau, and basic AI/ML for predictive work.
Soft skills: problem-solving and critical thinking, communicating insights clearly to non-technical stakeholders, business acumen to connect data to strategy, and data ethics — understanding responsible and private use of data.
Employers increasingly weigh the second set as heavily as the first, since raw technical skill without the ability to explain findings clearly is a common gap they screen for.
How Long Does It Take to Become Job-Ready?
Most structured programs run a few months of full-time-equivalent study, moving from foundational statistics and SQL through to Python/R and BI tools, with live projects layered in throughout rather than saved for the end. Programs that include paid internships tend to compress the "job-ready" timeline further, since students get real client exposure before graduating rather than after.
Why Choose Modulation Digital for a Data Analytics Course in Ghaziabad?
Choosing a Data Analytics Course in Ghaziabad is not only about learning software tools. The real value comes from practical exposure, structured learning, project experience, and career preparation. Modulation Digital focuses on combining these elements to create a more complete learning experience for aspiring data professionals.
Industry-Relevant Data Analytics Curriculum
The program is designed around the skills used across modern analytics workflows, including Advanced Excel, SQL, Python, statistics, data visualization, Power BI, Tableau, and AI-assisted analytics. This helps students progress from basic data handling to more advanced analysis and reporting.
Practical, Project-Based Learning
Instead of limiting learning to theoretical exercises, Modulation Digital emphasizes hands-on assignments and real-world projects. Students can practice cleaning datasets, writing SQL queries, performing analysis, developing dashboards, and presenting insights. This approach helps turn individual tool knowledge into an end-to-end analytics workflow.
Flexible Learning Options
Students can choose a learning format that fits their schedule, including offline classroom training and online learning options. Flexible batches can make the course more accessible to college students, freshers, and working professionals managing other commitments.
Career and Placement Support
Modulation Digital also focuses on the transition from training to employment through placement assistance, interview preparation, resume support, and career guidance. Students can use their projects and newly developed technical skills to build a stronger profile for entry-level opportunities.
Portfolio-Focused Approach
A major benefit of practical analytics training is the opportunity to develop portfolio projects. Rather than finishing with only a certificate, learners can demonstrate their ability to work with data, create dashboards, identify trends, and communicate actionable business insights.
A Practical Path Into Data Analytics
For learners looking for a Data Analytics Course in Ghaziabad, Modulation Digital provides a structured path that combines technical tools, practical projects, flexible learning, and career-oriented support—helping students build capabilities that extend beyond classroom theory.
FAQs
What is the duration of a data analytics course in Ghaziabad?
Programs typically run a few months, covering the full analytics lifecycle from foundational statistics through SQL, Python/R, and BI tools like Power BI and Tableau.
Who can enroll in a data analytics course?
Anyone building a career in analytics — students, working professionals, and freelancers — regardless of prior coding background.
What tools will I learn in the course?
A current syllabus covers Advanced Excel, SQL, Python or R, Power BI or Tableau, data cleaning, and increasingly, AI-assisted analytics tools.
What jobs can I get after completing the course?
Common roles include Data Analyst, Business Analyst, Data Scientist, Business Intelligence Analyst, Marketing Analyst, Financial Analyst, and Product Analyst.
What salary can I expect as a fresher in data analytics?
Freshers typically start around ₹3–6 LPA, with higher offers in major tech hubs or from larger companies.
Is Python or SQL more important to learn first?
SQL is usually the faster starting point since it's used to pull data out of real systems, while Python builds on that for deeper analysis and modeling.
Does the course include real project experience?
Reputable programs include live projects and, in some cases, paid internships with real client work rather than only simulated exercises.
Is prior experience required to join a data analytics course?
No — most programs are designed for beginners and build progressively toward advanced tools.
What soft skills matter for a data analyst role?
Communication, business acumen, and critical thinking matter as much as technical skill, since analysts need to explain findings to non-technical stakeholders.
Do data analytics institutes offer placement support?
Reputable institutes typically provide placement assistance with partner companies, along with resume building and interview preparation.
Can I study data analytics while working full-time?
Yes — many institutes offer flexible weekday and weekend batches, along with online options, for working professionals.
Conclusion
Choosing the right Data Analytics Course in Ghaziabad in 2026 means looking beyond a certificate and asking whether the program can actually prepare you to work with real business data. A modern analytics career requires more than Excel knowledge. Skills in SQL, Python or R, statistics, data cleaning, Power BI, Tableau, AI-assisted analytics, and data storytelling can give learners a stronger foundation for today's evolving job market.
The most valuable learning experience is one where these tools are connected through practical projects. Cleaning an imperfect dataset, querying a database, identifying patterns, building a dashboard, and explaining the final recommendation teaches far more than completing isolated software exercises.
Modulation Digital follows this practical direction by combining an industry-relevant curriculum with hands-on projects, flexible learning options, portfolio development, mentorship, and career support. For students, freshers, freelancers, and working professionals considering a Data Analytics Course in Ghaziabad, this approach can help bridge the gap between learning analytical tools and applying them to real-world problems.
Ultimately, becoming job-ready in data analytics is not about knowing the maximum number of tools. It is about knowing how to use the right tool to answer the right business question. Build strong fundamentals, practice with real datasets, create meaningful projects, and continuously improve your analytical thinking. That combination will matter far more than simply having a course certificate on your resume.