
Why Statistics Matters So Much in Data Science
Statistics is the foundation that makes data science more than just coding and tools. It's what allows someone to determine whether a pattern in data is genuinely meaningful or simply random noise, whether a business decision is backed by real evidence, and whether a machine learning model's results can actually be trusted. Without statistical thinking, data science becomes guesswork dressed up with fancy software.
Descriptive vs Inferential Statistics — The Core Distinction
This is one of the most important concepts to understand early on:
| Type | What It Does | Example |
| Descriptive Statistics | Summarizes and describes existing data | Average sales, most common customer age group |
| Inferential Statistics | Draws conclusions or predictions about a larger population from a sample | Predicting overall customer satisfaction from a survey sample |
Descriptive statistics tells you what the data shows; inferential statistics helps you make broader claims beyond just the data in front of you.
Core Statistical Concepts Every Beginner Should Learn
A handful of foundational concepts cover most of what's needed to get started:
- Mean, median, and mode — the different ways to describe a "typical" value in a dataset
- Standard deviation and variance — measuring how spread out data points are from the average
- Probability basics — understanding likelihood, which underlies most statistical reasoning
- Distributions — recognizing common patterns like the normal distribution in real-world data
- Correlation vs causation — understanding that two things moving together doesn't mean one causes the other
- Hypothesis testing — a structured way to determine whether an observed effect is likely real or due to chance
Step-by-Step Path to Building Statistical Skills
Here's a realistic sequence for building statistical knowledge from scratch:
- Start with descriptive statistics — get comfortable summarizing data before moving into more complex ideas
- Learn basic probability — understand core concepts like independent events and conditional probability
- Study common distributions — particularly the normal distribution, since it underlies many statistical methods
- Learn hypothesis testing — understand p-values, confidence intervals, and what statistical significance actually means
- Practice with real datasets — apply these concepts to actual data rather than only working through abstract examples
- Connect statistics to machine learning — understand how these foundations support predictive modeling later on
Probability and Distributions — Why They Matter
Probability forms the backbone of statistical reasoning, helping quantify uncertainty rather than dealing in absolutes. Understanding distributions — particularly recognizing when data follows a normal distribution versus a skewed one — affects which statistical methods are appropriate to use. Applying the wrong method to the wrong type of distribution is a common source of flawed analysis, even when the underlying math is technically correct.
Understanding Hypothesis Testing Without the Jargon
Hypothesis testing often intimidates beginners because of unfamiliar terms like p-values and null hypotheses, but the underlying idea is fairly intuitive. It's essentially a structured way of asking: "Is this result likely real, or could it have happened by random chance?" A p-value indicates how surprising the observed data would be if there were actually no real effect — a smaller p-value suggests the result is less likely to be due to chance alone.
Common Mistakes Beginners Make Learning Statistics
| Mistake | Why It's a Problem |
| Confusing correlation with causation | Leads to incorrect conclusions about what's actually driving results |
| Misinterpreting p-values | A common source of flawed conclusions, even among experienced analysts |
| Ignoring sample size issues | Small samples can produce misleading, unreliable statistical results |
| Memorizing formulas without understanding concepts | Makes it difficult to apply statistics correctly to new, unfamiliar situations |
How Statistics Connects to Machine Learning
Machine learning isn't a separate discipline from statistics — it builds directly on statistical foundations. Concepts like probability distributions inform how models make predictions, while statistical evaluation methods determine whether a model is actually performing well or simply overfitting to its training data. Strong statistical understanding tends to separate data scientists who can genuinely evaluate their models from those who only know how to run pre-built code.
About Modulation Digital
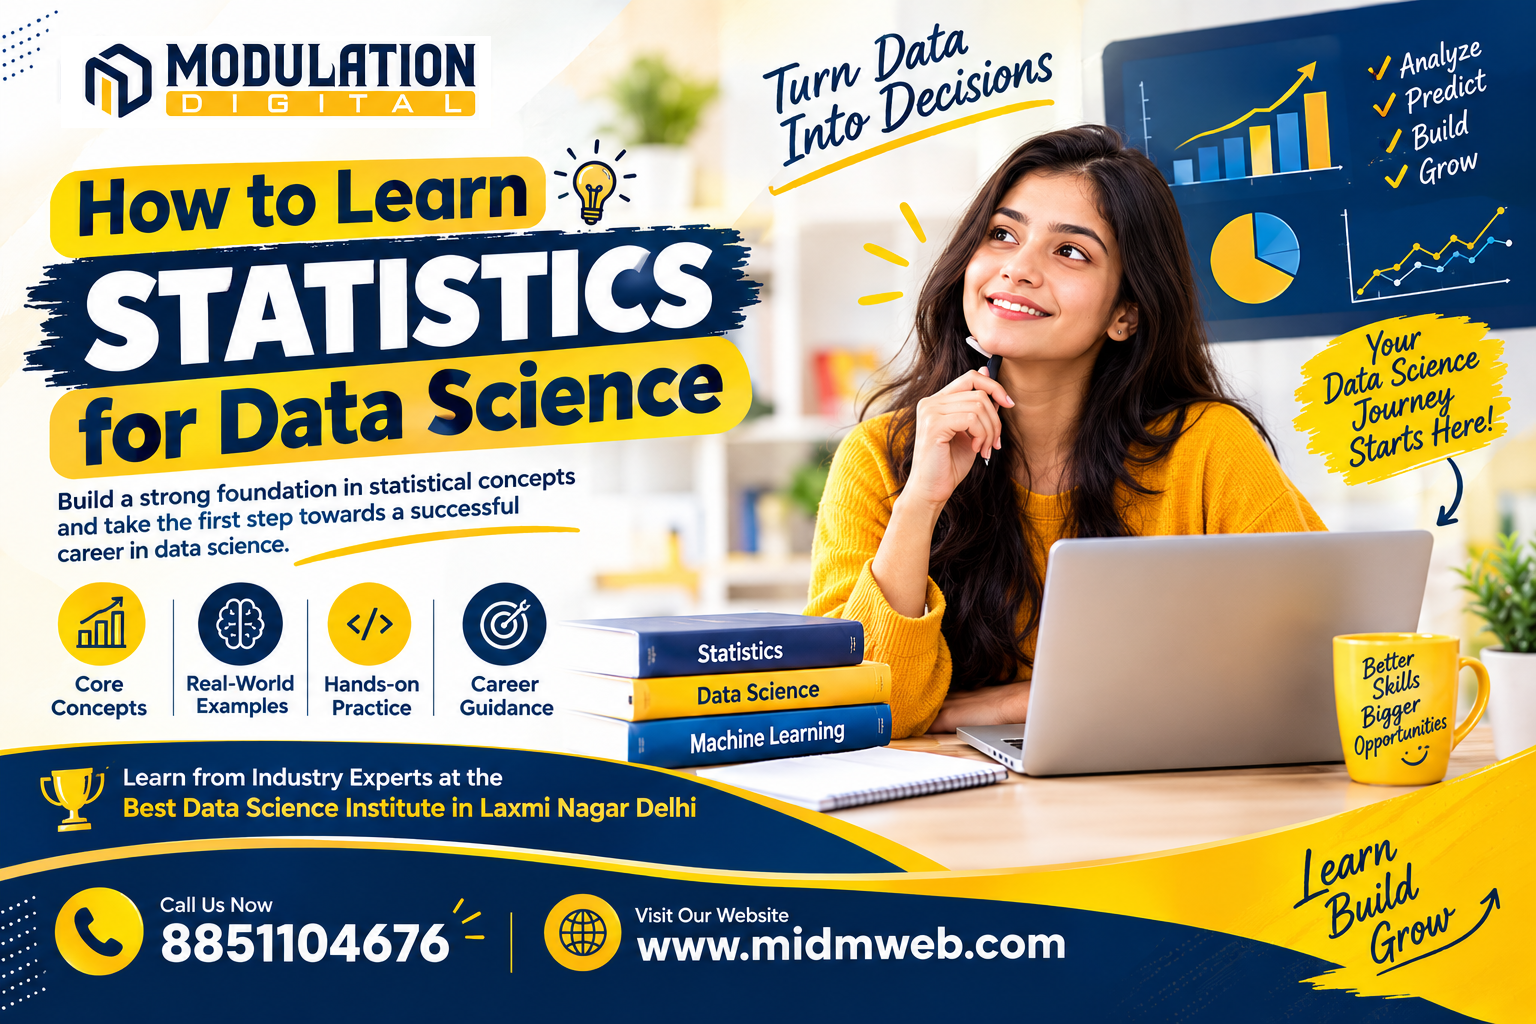
Modulation Digital is a Best Data Science Institute in Laxmi Nagar Delhi built around practical, hands-on learning. Students apply statistical concepts to real datasets throughout their training, connecting theory directly to genuine business and analytical scenarios.
Meet Your Trainers
Learning statistics and broader data skills at Modulation Digital means training under three specialists:
| Trainer | Specialization | Experience |
| Shivam | Data Analytics | 5+ years |
| Vishal | Data Science | 14+ years |
| Gulshan | Data Science | 6+ years |
Shivam introduces core statistical concepts as part of the analytics curriculum, helping students apply them directly to real business reporting and decision-making.
Vishal, with over a decade of industry experience, guides students through more advanced statistical applications used in machine learning and predictive modeling.
Gulshan works alongside Vishal, helping students strengthen their practical understanding of statistics through guided, hands-on exercises.
Frequently Asked Questions (FAQs)
1. Do I need advanced math to learn this subject for a data role? No, a solid grasp of basic algebra is usually enough to start — deeper mathematical theory can come later as needed.
2. What's the difference between statistics and data analysis? Statistics provides the theoretical framework and methods, while data analysis applies those methods to actual datasets to extract insights.
3. Is it necessary to learn statistics before machine learning? Yes, strong statistical understanding makes machine learning concepts significantly easier to grasp and apply correctly.
4. What is a p-value in simple terms? It indicates how likely an observed result would occur if there were actually no real effect, helping assess whether findings are meaningful.
5. How long does it take to learn the basics for a data-focused role? With consistent practice, most beginners can grasp core concepts within 2 to 3 months of focused study.
6. Is correlation the same as causation? No, correlation means two variables move together, while causation means one variable actually causes the change in another.
7. What tools are commonly used to apply statistics in data science? Python, R, and Excel are commonly used, often alongside specialized statistical libraries for more advanced analysis.
8. Why do sample sizes matter in statistics? Small sample sizes can produce misleading results that don't accurately represent the larger population being studied.
9. Is statistics only useful for data scientists? No, it's valuable across business analytics, research, healthcare, finance, and virtually any field involving data-driven decisions.
10. What is a normal distribution, and why is it important? It's a common data pattern where most values cluster around the average, forming the basis for many standard statistical methods.
11. Can I learn statistics through online resources alone? Yes, though structured guidance often helps clarify commonly misunderstood concepts faster than self-study alone.
12. What is the difference between population and sample in statistics? A population includes all possible data points of interest, while a sample is a smaller subset used to draw conclusions about that population.
13. Is statistics harder to learn than programming for data science? Many beginners find statistics more conceptually challenging initially, though both skills become more manageable with consistent practice.
14. How is statistics used in A/B testing? Hypothesis testing methods determine whether differences between two tested versions are statistically significant or simply due to chance.
15. Once I understand statistics, how do I apply that knowledge to build full applications around data-driven products? That involves broader development skills, including modern JavaScript-based stacks. It's covered in detail in our other guide: What is the MERN Stack and How to Learn It
Conclusion
Learning statistics for data science effectively comes down to building genuine conceptual understanding — not just memorizing formulas — starting with descriptive statistics and gradually working toward hypothesis testing and probability. These foundations directly support everything from basic reporting to advanced machine learning work. If you're ready to learn this properly, Modulation Digital, a trusted Best Data Science Institute in Laxmi Nagar Delhi, offers structured training under experienced mentors across data analytics and data science. Reach out today to book a free counselling session.